GeoMap for Gnuplot
This is based on the gnuplot-geomap, which provides datasets for GeoMap for the ease of use in gnuplot. The original format is shapefile, and here I converted it into plain txt.
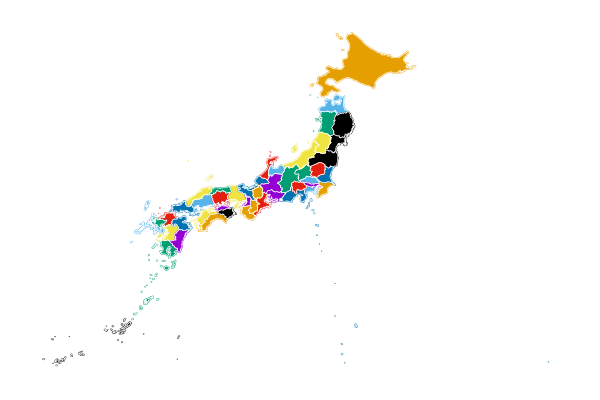
The following is an example of Japan:
file = 'japan1st'
cnt = 46
set term pngcairo transparent size 600,400 enhanced font 'Verdana,20'
set out file.".png"

unset key
set border 0
unset tics

set style line 1 lc rgb '#ffffff' lt 1 lw 0.5 # --- white

stats file.'.txt' u 1 nooutput
set xrange [STATS_min:STATS_max]

plot for [idx=0:cnt] file.'.txt' i idx u 1:2 w filledcurves, '' u 1:2 w lines ls 1
Download
Asia
- Japan: First-level Administrative Divisions 2015. It contains 47 regions. (shapefile, gnuplot txt)
- Taiwan: Second-level Administrative Divisions, Taiwan, 2015. It contains 22 regions. (shapefile, gnuplot txt)
- Chengdu: First-level Administrative Divisions, 2021. It contains 22 regions. (shapefile, gnuplot txt)